Welcome to BlenderNC’s documentation!
BlenderNC
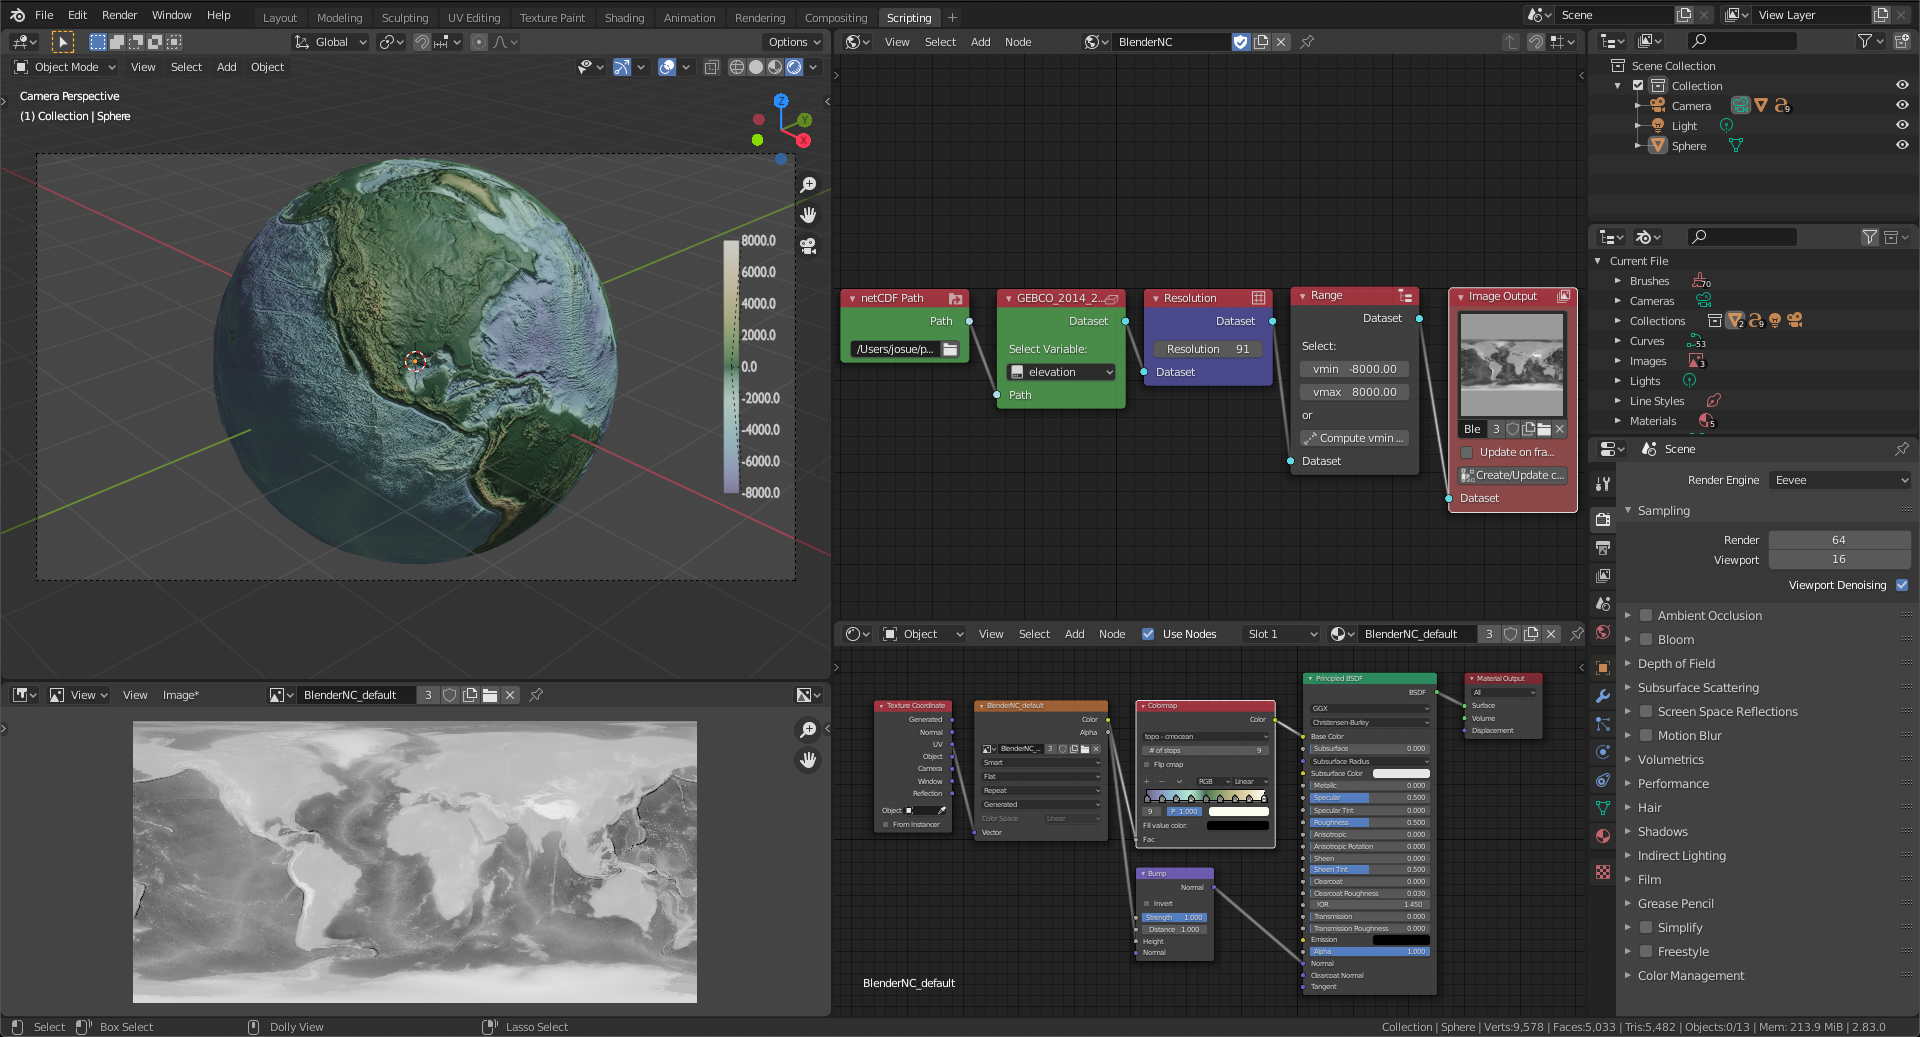
BlenderNC is a Blender add-on that allows importing datacubes into Blender (i.e. netCDF, cfGrib, and zarr files). It allows 2D and 3D visualization and the generation of scientific data animations. The main development of BlenderNC currently focuses on geo-spatial data (i.e. Oceanographic - Atmospheric data), however, the framework should support the load of any datacube.
Quick Start
Examples
API Reference
Indices and tables
Support
BlenderNC is supported by:
BlenderNC is part of the ECMWF Summer of Weather Code 2021, an innovation program organised by the European Centre for Medium-Range Weather Forecasts focusing on weather- and climate-related open-source developments. The sponsored work aims to implement and improve support of weather and climate data visualizations in GRIB format within BlenderNC.

Consortium for Ocean-Sea Ice Modelling in Australia (COSIMA) funds development of BlenderNC to visualize numerical models of the global ocean and sea ice (ACCESS-OM2).
Community
This section show animations submitted by the BlenderNC users.
The animation by JoshuaB-L shows equivalent potential temperature (theta-e) of the adiabatic process - air moving across a warming urban surface from 10:00-11:00 am on 16-07-2018 at Potsdamer Platz, Berlin. The wind speed is 7.2 km/h considered a factor of 2 on the Beaufort Scale (‘Light breeze’). The temperature scale is shown in Kelvins (i.e. 20.85 °C - 28.65 °C range). Convection of the rising air parcels is clearly visible from the ground and building surfaces. Heat transfer occurs due to the mixing of warm air (at ground level z0) and cool air (above the building canopy) caused by the turbulent rising eddies. Thus, the ambient air temperature of the urban environment rises. The simulation model used is PALM in LES mode. More information can be found here.